 OpenDaylight Documentation
Nitrogen
OpenDaylight Documentation
Nitrogen
This section introduces you to the OpenDaylight User Experience (DLUX) application.
DLUX provides a number of different Karaf features, which you can enable and disable separately. They are:
- odl-dlux-core
- odl-dluxapps-nodes
- odl-dluxapps-topology
- odl-dluxapps-yangui
- odl-dluxapps-yangvisualizer
- odl-dluxapps-yangman
To log in to DLUX, after installing the application:
Note
OpenDaylight’s default credentials are admin for both the username and password.
After you login to DLUX, if you enable only odl-dlux-core feature, you will see only topology application available in the left pane.
Note
To make sure topology displays all the details, enable the odl-l2switch-switch feature in Karaf.
DLUX has other applications such as node, yang UI and those apps won’t show up, until you enable their features odl-dluxapps-nodes and odl-dluxapps-yangui respectively in the Karaf distribution.
DLUX Modules
Note
If you install your application in dlux, they will also show up on the left hand navigation after browser page refresh.
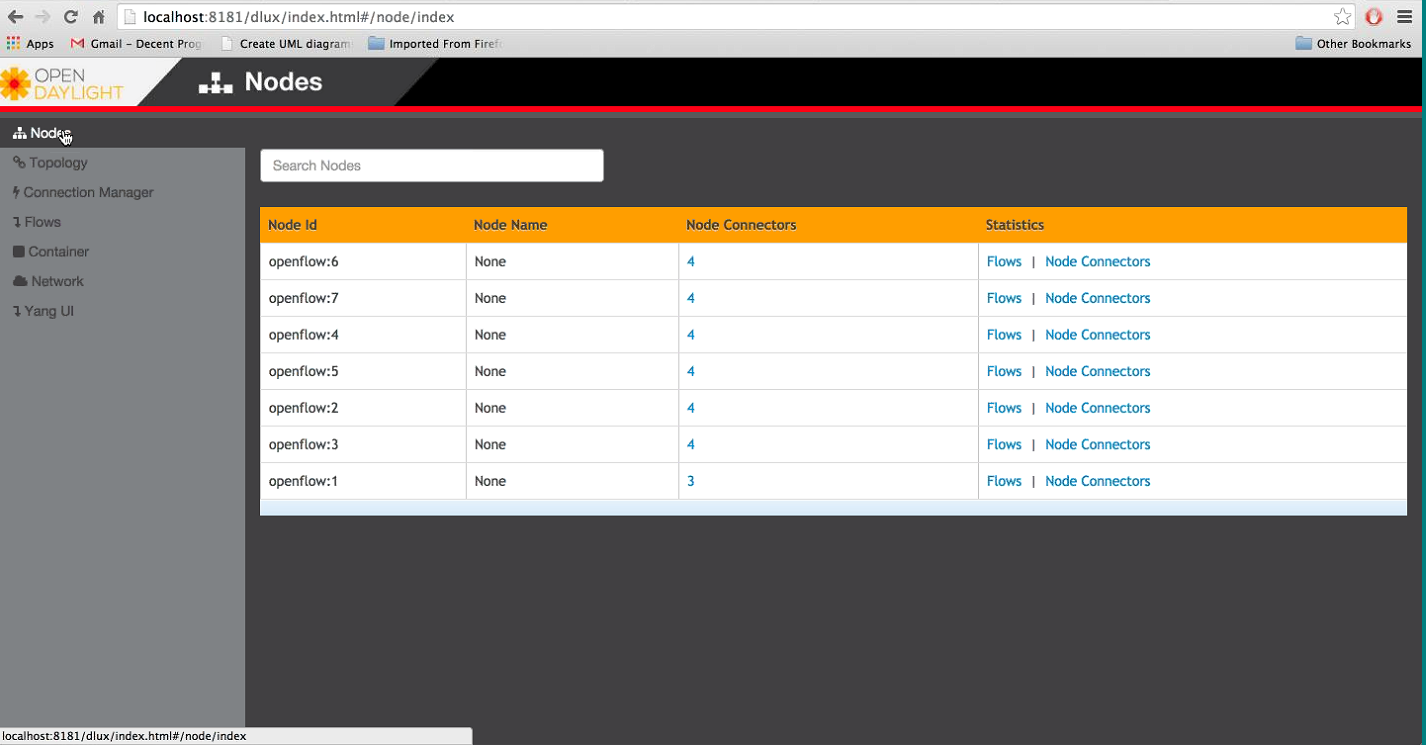
The Nodes module on the left pane enables you to view the network statistics and port information for the switches in the network.
To use the Nodes module:
The Topology tab displays a graphical representation of network topology created.
Note
DLUX does not allow for editing or adding topology information. The topology is generated and edited in other modules, e.g., the OpenFlow plugin. OpenDaylight stores this information in the MD-SAL datastore where DLUX can read and display it.
To view network topology:
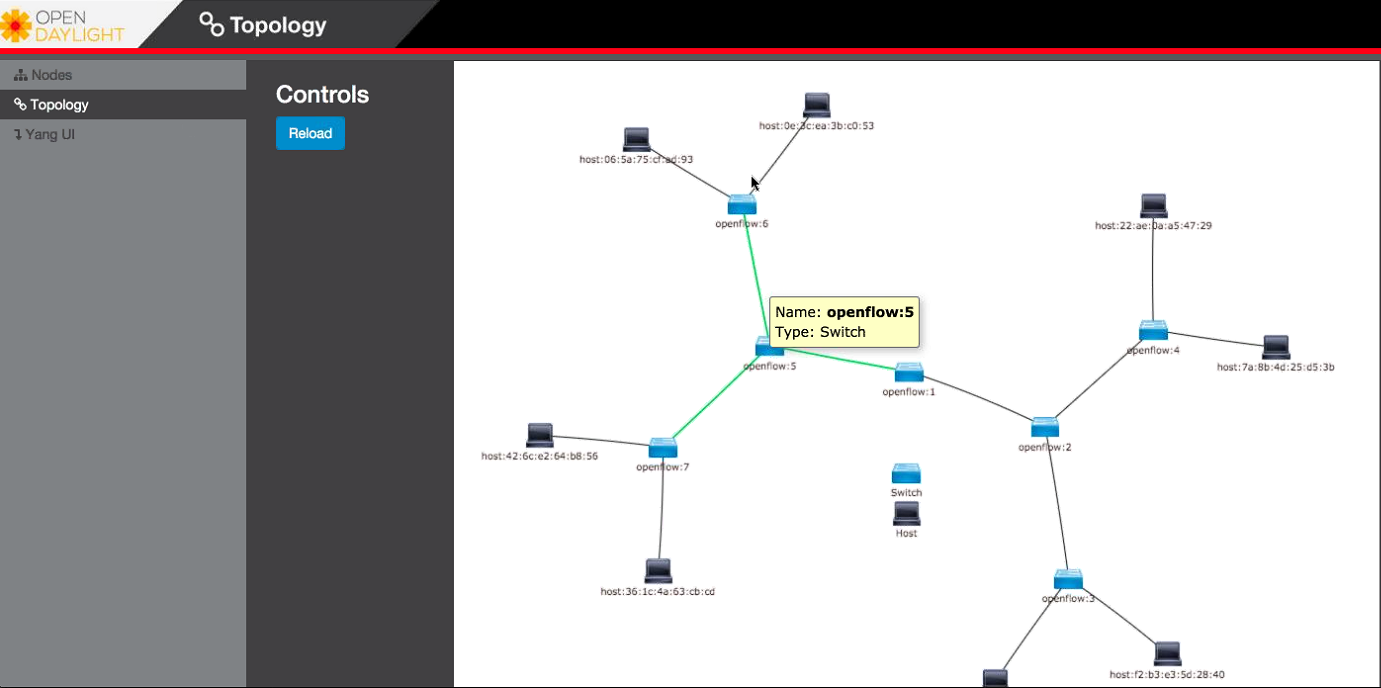
Topology Module
The Yang UI module enables you to interact with the YANG-based MD-SAL datastore. For more information about YANG and how it interacts with the MD-SAL datastore, see the Controller and YANG Tools section of the OpenDaylight Developer Guide.
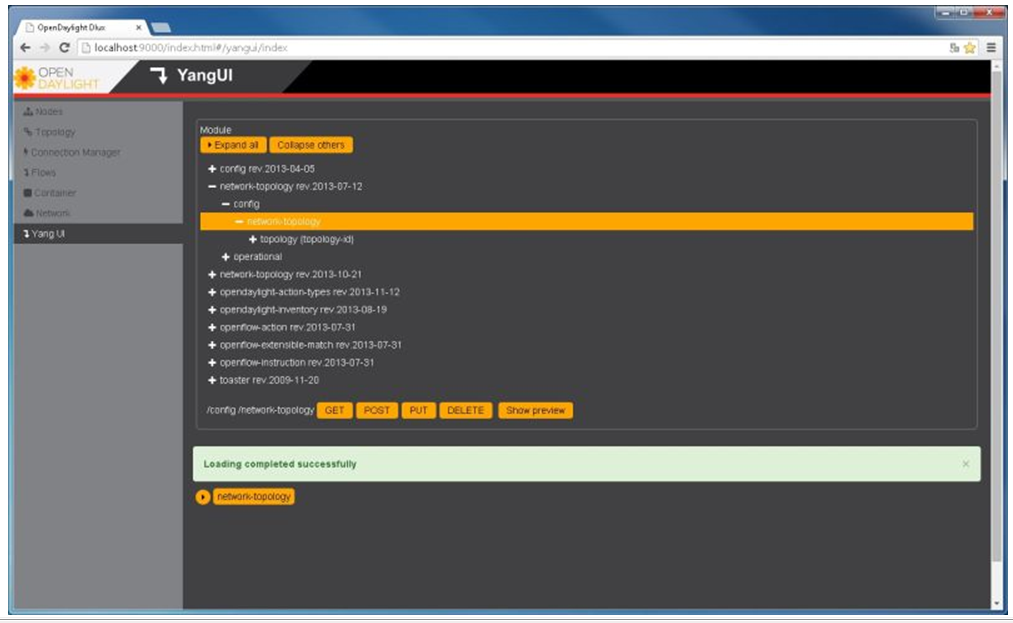
Yang UI
To use Yang UI:
Select Yang UI on the left pane. The right pane is divided in two parts.
The top part displays a tree of APIs, subAPIs, and buttons to call possible functions (GET, POST, PUT, and DELETE).
Note
every subAPI can call every function. For example, subAPIs in the operational store have GET functionality only.
Inputs can be filled from OpenDaylight when existing data from OpenDaylight is displayed or can be filled by user on the page and sent to OpenDaylight.
Buttons under the API tree are variable. It depends on subAPI specifications. Common buttons are:
GET to get data from OpenDaylight,
PUT and POST for sending data to OpenDaylight for saving
DELETE for sending data to OpenDaylight for deleting.
You must specify the xpath for all these operations. This path is displayed in the same row before buttons and it may include text inputs for specific path element identifiers.
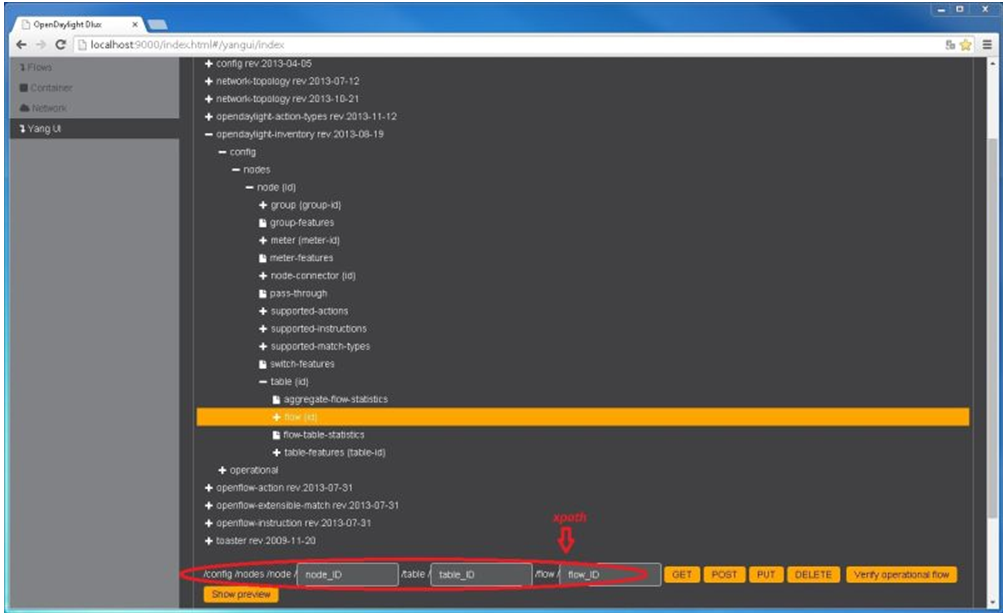
Yang API Specification
The bottom part of the right pane displays inputs according to the chosen subAPI.
Lists are handled as a special case. For example, a device can store multiple flows. In this case “flow” is name of the list and every list element is identified by a unique key value. Elements of a list can, in turn, contain other lists.
In Yang UI, each list element is rendered with the name of the list it belongs to, its key, its value, and a button for removing it from the list.
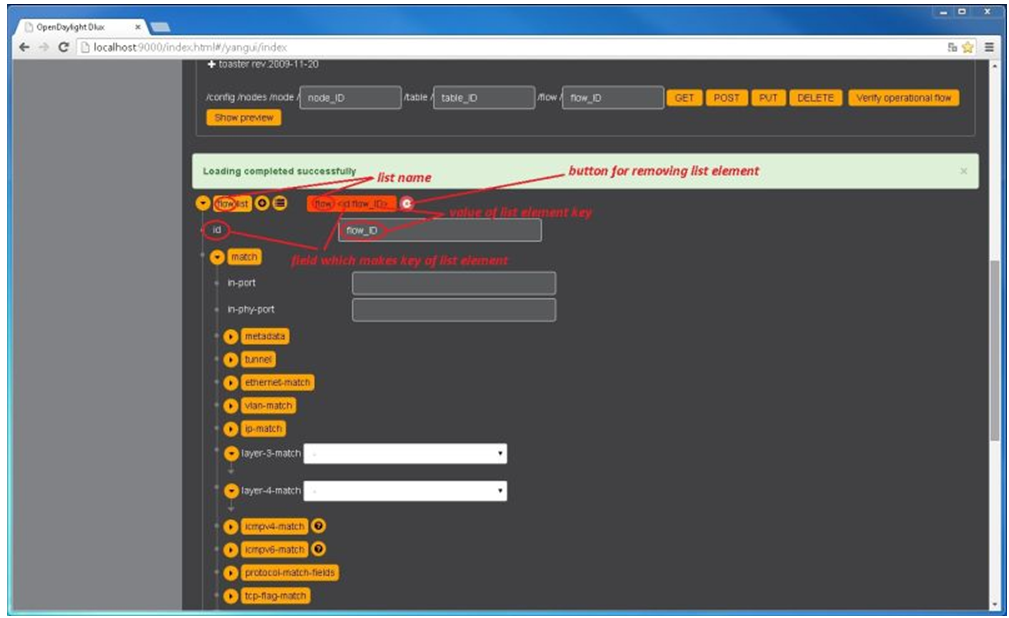
Yang UI API Specification
After filling in the relevant inputs, click the Show Preview button under the API tree to display request that will be sent to OpenDaylight. A pane is displayed on the right side with text of request when some input is filled.
To display topology:
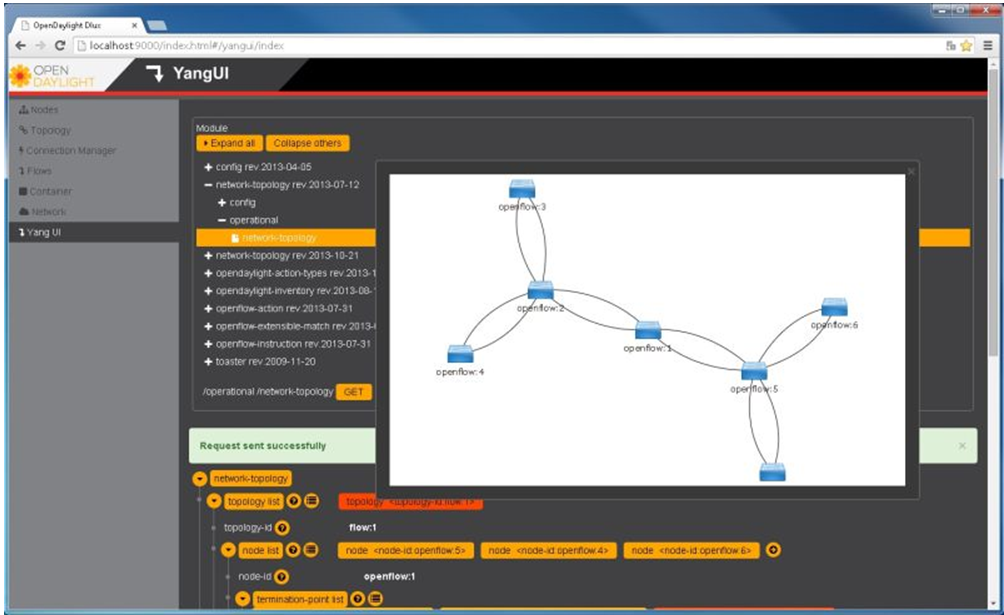
DLUX Yang Topology
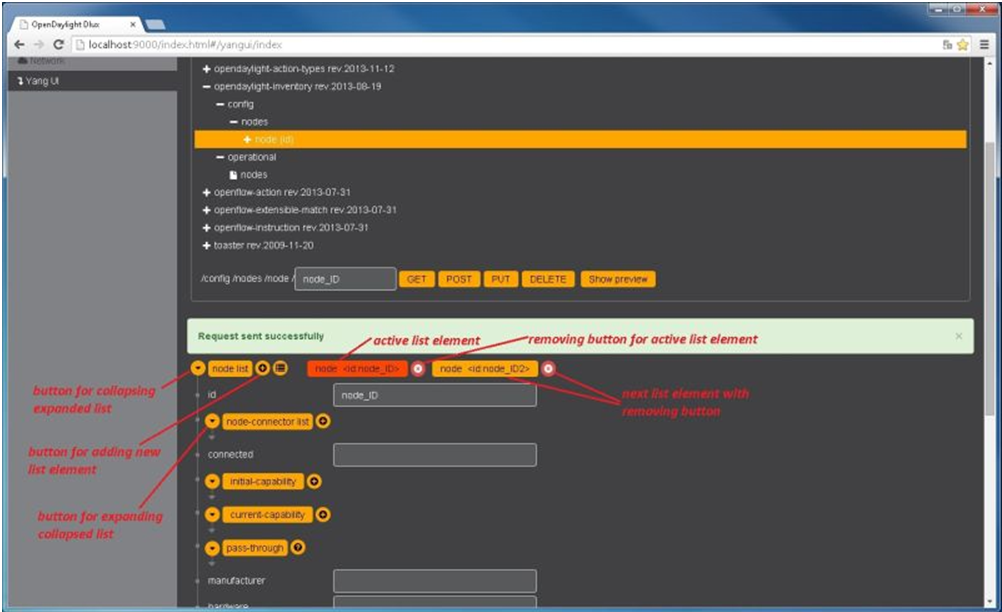
Lists in Yang UI are displayed as trees. To expand or collapse a list, click the arrow before name of the list. To configure list elements in Yang UI:
To add a new list element with empty inputs use the plus icon-button + that is provided after list name.
To remove several list elements, use the X button that is provided after every list element.
DLUX List Elements
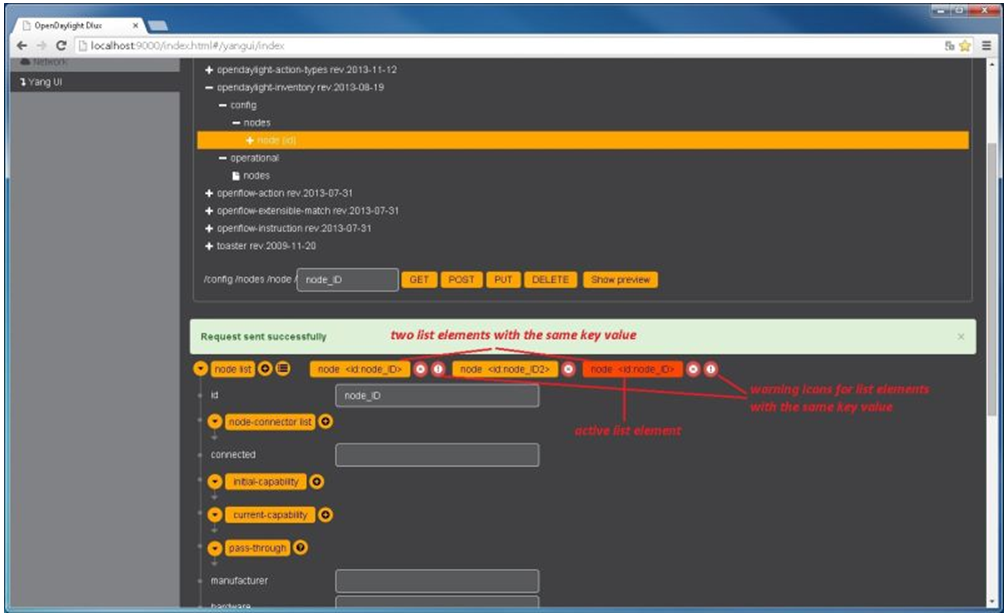
In the YANG-based data store all elements of a list must have a unique key. If you try to assign two or more elements the same key, a warning icon ! is displayed near their name buttons.
DLUX List Warnings
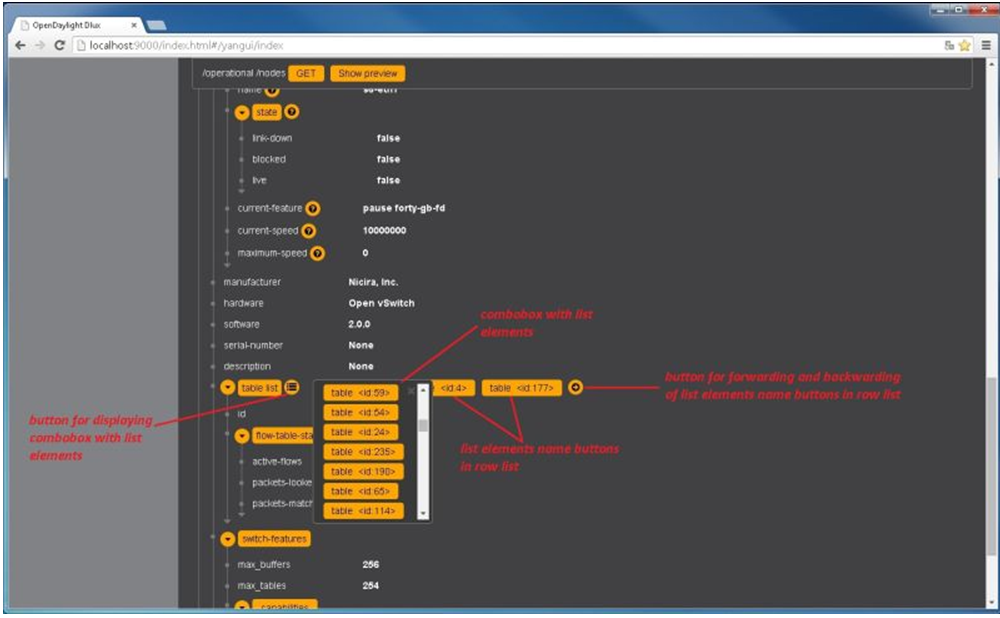
When the list contains at least one list element, after the + icon, there are buttons to select each individual list element. You can choose one of them by clicking on it. In addition, to the right of the list name, there is a button which will display a vertically scrollable pane with all the list elements.
DLUX List Button1